Engagement from electric utilities in transportation electrification is on the rise and approved investment now totals almost $1.4 billion, 80 percent of which has occurred in the last two years. The ratio of approved elements of programs (filings) on the EV Hub Utility Filings Dashboard reveals a “batting average.” Cumulatively, utilities are batting 0.771, meaning 77 percent of all filings since 2013 have received commission approval. While a significant majority of programs have been approved by regulatory commissions, many were modified first. A closer look at utility proposals and decisions offers insights into why some utilities strike out when they first step up to the plate.
The favorable batting average doesn’t capture the nuance of the regulatory commission process and the back-and-forth between utilities, regulators, and the stakeholder community. While a baseball player has only moments to react and adapt to changing conditions, electric utilities have months to modify their proposals and improve their chances of approval. Modifications to transportation electrification have been commonplace and utilities have often reduced or increased budgets, shifted their role in a program, or reallocated funds within a program to prioritize certain customer groups. Out of the 242 approved filings, 44 percent were modified in some way before a final approval was issued. Importantly, these modified approvals make up more than 85 percent of all approved utility investment totals. The most well-documented of which was a $650 million proposal by Pacific Gas & Electric in California in 2015 that was under consideration for nearly two years before a much smaller program was approved worth less than $150 million.
In some cases such as Ameren Missouri’s Charge Ahead Program, a strikeout in the early innings can lead to a smarter plate appearance later in the game. The commission decided Ameren’s original proposal did not demonstrate sufficient public benefit, threatened market competition, and conveyed too much expense to the ratepayer to be approved. The utility returned with a modified budget that prioritized different customer groups and won approval for an additional $6.6 million for the program in October 2019.
Of the 54 filing elements worth $241 million that have been denied since 2015, 30 were denied by commissions because the utility did not sufficiently demonstrate the benefits of the proposed program. Of these program elements, seven were rejected for additional reasons. The table below outlines all of the reasons why certain program elements were denied and the frequency at which those reasons were cited by commissions.
REASONS FOR COMMISSION DENIAL AND UTILITY WITHDRAWAL OR POSTPONEMENT
|
Reason for Commission Denial |
Filings |
Other Reason Cited (Number of Filings) |
Multiple Reasons Cited (Number of Filings) |
|
Insufficient Demonstration of Benefits |
30 |
Funds Relocated (1), Insufficient Market Research (1), Overlap with Existing Program (1), Market Competition (1), Design Flaw (1), |
Design Flaw and Equity Insufficiently Prioritized (1), Insufficient Market Research and Market Competition (1) |
|
None Provided |
8 |
None |
None |
|
Part of Denied Program |
6 |
None |
None |
|
Insufficient Evaluation Data from Existing Programs |
3 |
None |
None |
|
Insufficient Market Research |
3 |
None |
None |
|
Not Utility’s Role |
3 |
None |
None |
|
Market Competition |
2 |
Not Utility’s Role (2) |
|
|
Funds Relocated |
2 |
None |
None |
This tables show the reasons why filings were denied by the commissions or withdrawn by the utilities. Insufficient demonstration of benefits was the leading reason for denial.
Source: Utility Filings Dashboard
Several programs were withdrawn directly by utilities with one notable program in California resulting in the loss of 60,000 charging stations. Commissions have changed the role of the utility in some cases and changed the financial structure of programs in others. For San Diego Gas and Electric, changes in the utility’s ability to recover costs from the project resulted in them withdrawing a $137 million residential charging program in February 2019.
While commission-ordered shifts in the utility’s role often do not result in withdrawals, some utility roles have a higher approval rate than others. Utility investments in make-ready infrastructure for EV charging have the highest approval rate at 94 percent compared to 85 percent approval for programs proposing utility ownership. At least three programs worth more than $166 million were only approved after the Commission changed the program to include investment in make-ready infrastructure instead of utility-owned charging stations. Financial incentives like rebates for charging infrastructure were the least successful, though they still had an approval rate of 72 percent.
Beyond a utility’s direct role in a project, the customer groups—or use targets—that are prioritized for different projects influences approval rates as well. Programs focusing on providing charging infrastructure for the general public saw the highest approval rating of 91 percent. Programs investing in charging infrastructure for workplaces and electric trucks and buses followed with 87 and 85 percent approval rates, respectively. Programs focused on multi-unit dwellings were approved at a rate of 84 percent while 66 percent of programs were approved for single family and other residential charging programs. Programs including investment in underserved communities also saw high approval rates where more than 85 percent of programs including this focus were approved.
Regional variation is another factor that appears to influence approval rates, and utilities in some regions are batting higher than others. Excluding the Rocky Mountain region, which only has one approved filing and no denials so far, the West Coast has the highest regional approval rate at 93 percent. The Lower Atlantic region has the lowest approval rate at 25 percent and the second lowest number of total programs with only four filings receiving commission decisions so far (see figure below). In California, high batting averages coincide with large investment; utilities in the Golden State account for more than 75 percent of all approved utility investment in transportation electrification.
REGIONAL VARIATION IN APPROVAL RATE
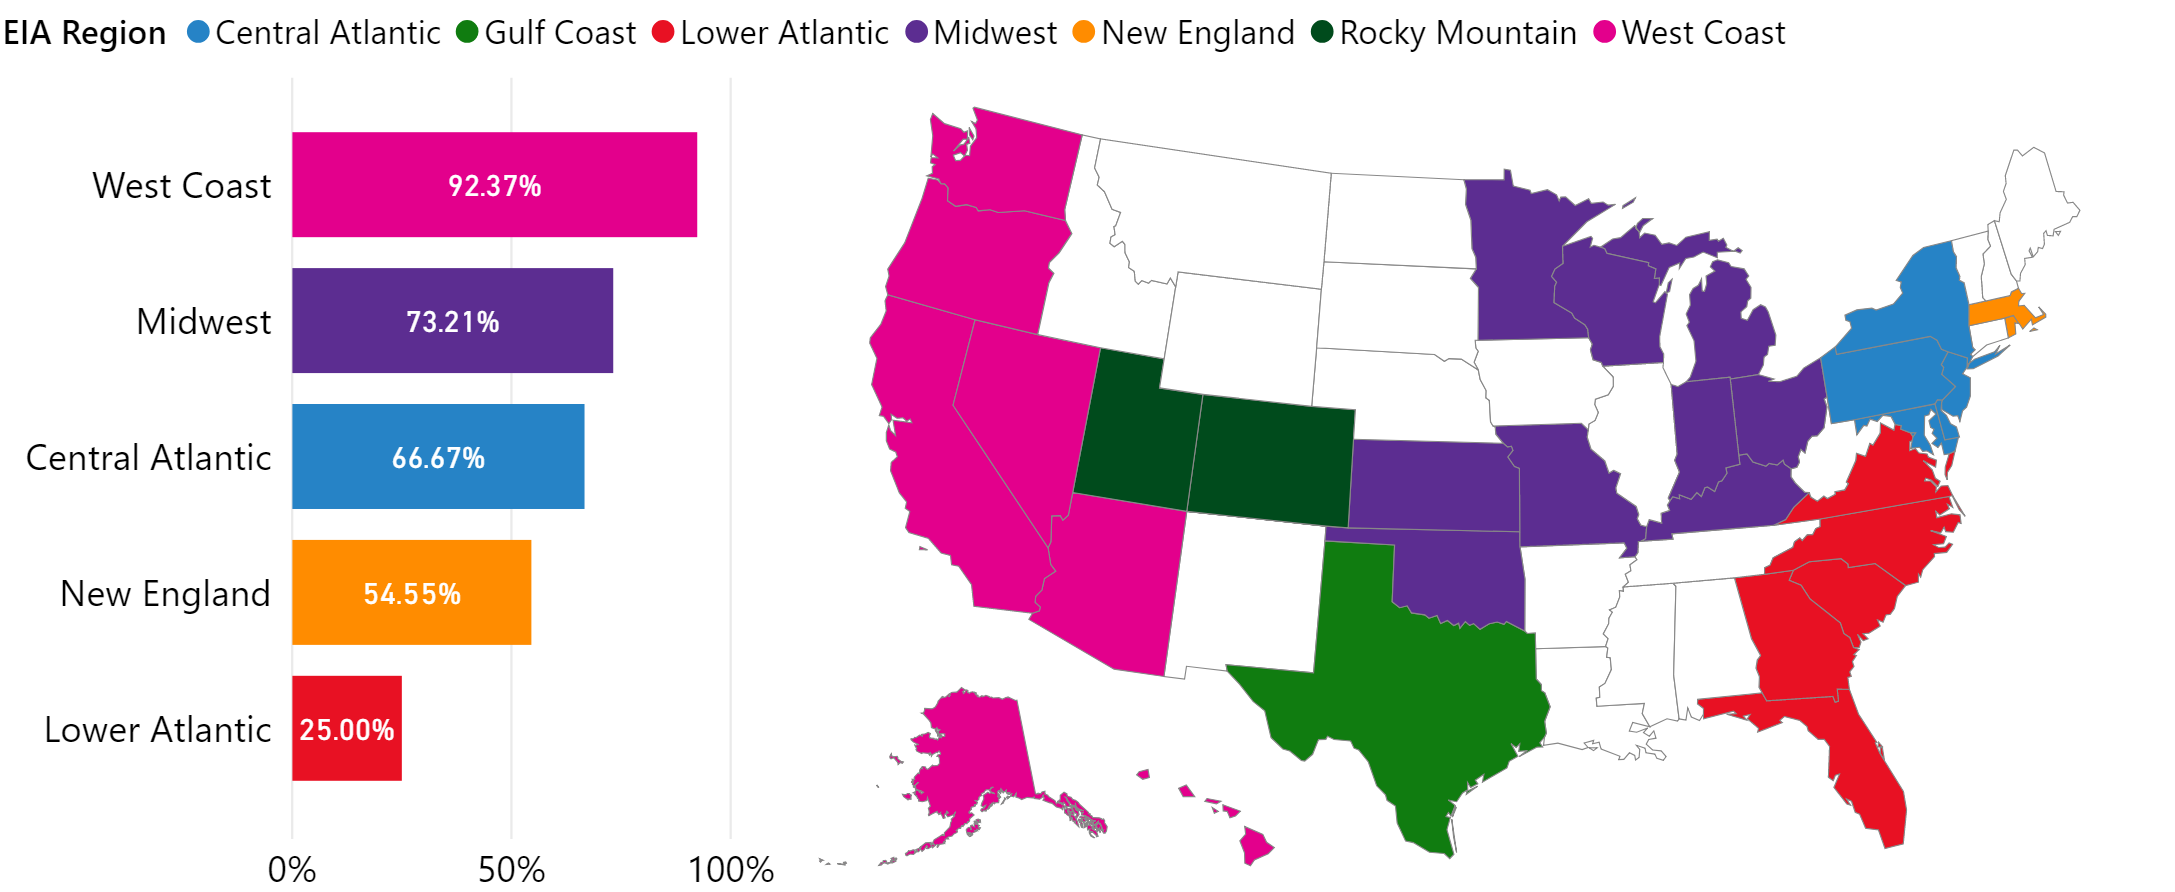
This chart shows the approval rate by U.S. Energy Information Administration region.
Source: Utility Filing Dashboard
In baseball, all at-bats contribute equally to the player’s average, even if a hit wins the World Series. The same is true with electric utility approval rates, which can obscure important context. For example, National Grid in Massachusetts has a batting average of 0.579, which seems favorable at first glance. However, the utility has only $30 million in approved programs since 2018 and was recently denied an almost $154 million program, contributing to the lower regional approval rating for New England shown above. The commission cited a lack of evaluation data from their Phase 1 EV Program as a primary reason for the denial and stressed the importance of further learning as the utility completes its existing programs. In this case, it looks like National Grid was fooled by an off-speed pitch.
The same issue applies when comparing yearly averages on a percentage basis where approval ratings do not entirely reflect investment loss. While approval rates were 15 percent higher in 2019 than they were in 2017, denied and withdrawn investment from 2019 exceeded lost investment in 2017 by more than $300 million. The figure below shows the fluctuation in approval rates over time.
UTILITY FILINGS STATUS OVER TIME
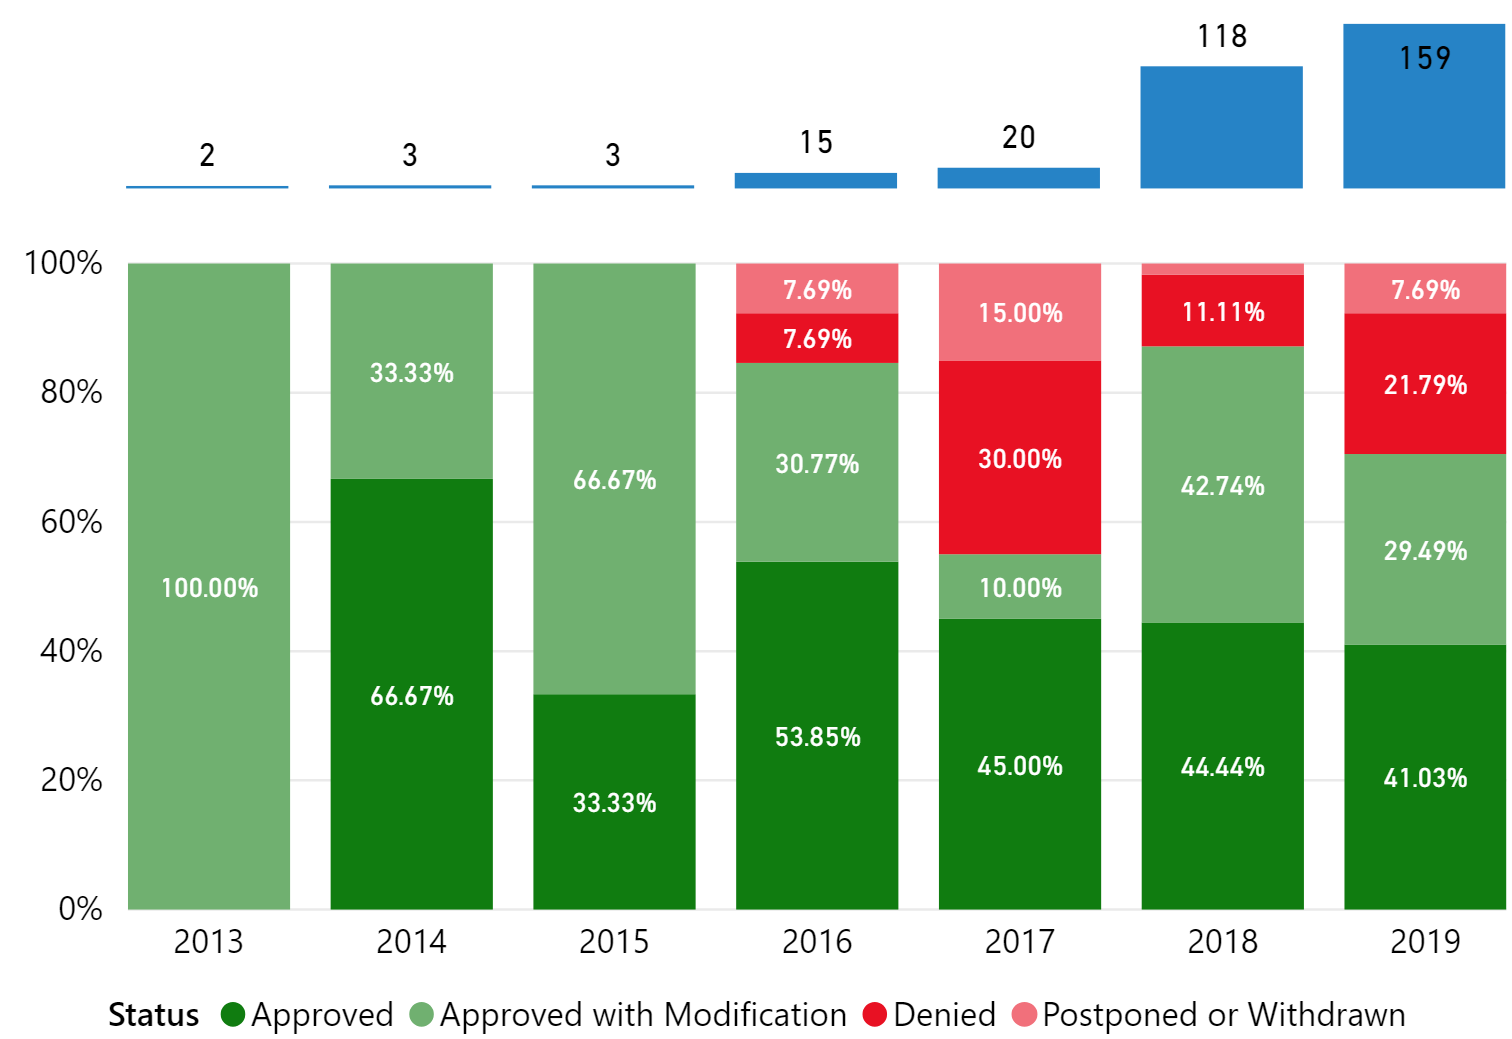
This chart shows the changes in utility approval rates over time. Approval rates reached a low point in 2017. The total filings per year is shown at the top of the figure.
Source: Utility Filing Dashboard
The figure above shows that after ramping up filing activity and receiving many denials in 2017, utilities have adjusted their strategy to reflect lessons learned. A surge in filing activity in 2018 and 2019 has coincided with higher approval ratings compared to the low point reached in 2017. Consumers Energy in Michigan exemplify this learning process. After withdrawing EV charging programs in 2017 due to concerns around their ability to recover the cost of investment, the utility participated in statewide stakeholder workshops to understand how they could best jumpstart the EV charging market in their service territory. They used the learnings from this process to develop a revamped program worth $10 million. The new program identified specific market segments for investment and included more focus on education and outreach. The commission approved Consumers Energy’s proposal in January 2019.
With $1.4 billion in utility funding for transportation electrification in the balance at the start of 2020, utilities must continue to learn from others, follow good practices outlined by the industry, and have patience at the plate. Electric utilities are expected to continue to play a vital role in closing the charging infrastructure gap and engaging underserved communities in ways that the private market may not be able to. EV Hub will continue to track all regulatory proceedings related to transportation electrification allowing utilities and other stakeholders to draw on this shared experience and enhance everyone’s chances of knocking one out of the park.
Related Content on EV Hub
Learn More