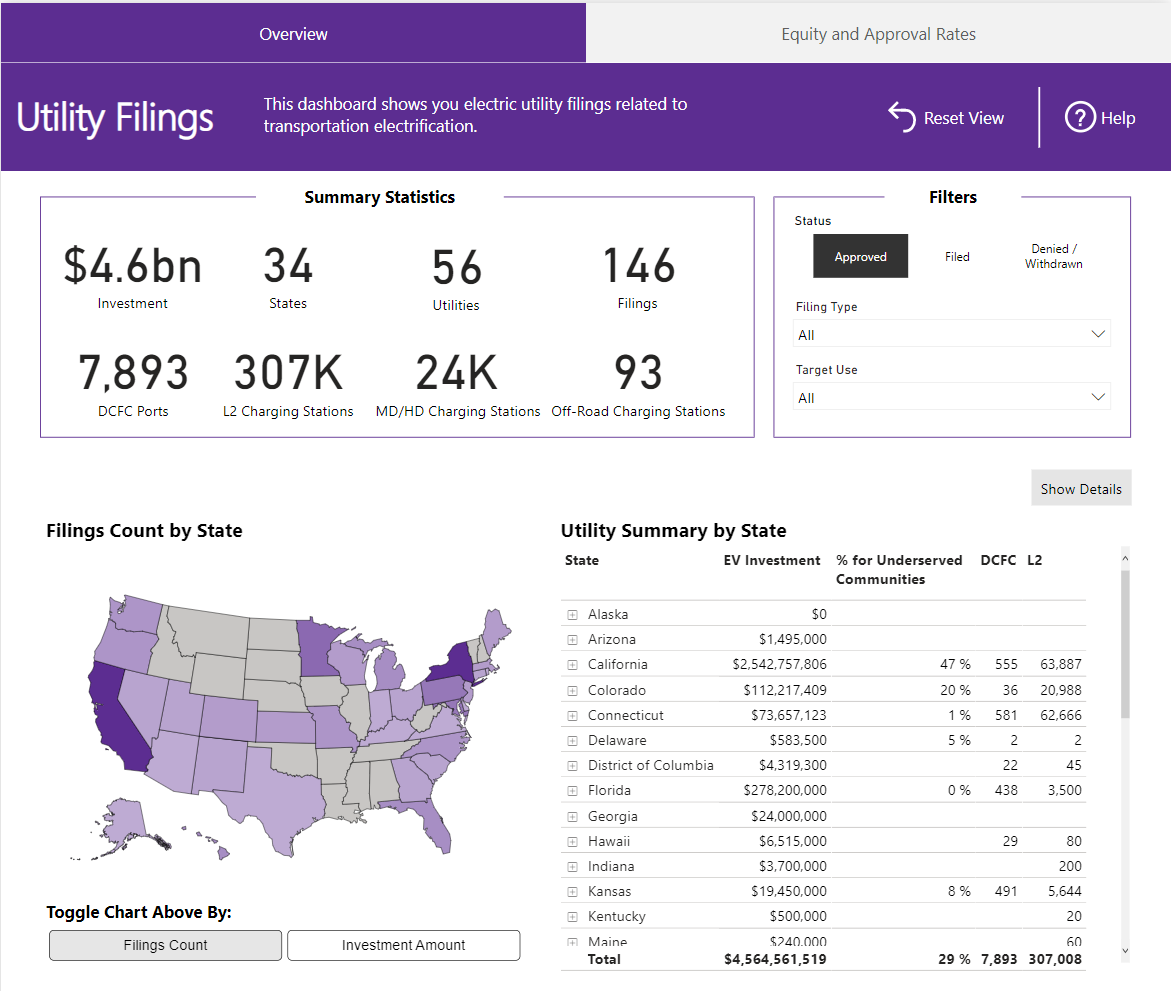
Electric utilities are looking to fill in the electric vehicle infrastructure gaps faced by cities across the country. Investor-owned utilities have already been approved to invest over $1 billion in programs to support the growing EV charging market according to data we’ve collected for the Electric Utility Filings Dashboard. These utilities are not operating in vacuum and often depend on supportive public policies to successfully implement their programs. When used in conjunction with the Local EV Deployment Dashboard, the new utility filings dashboard reveals a close connection between supportive public policy, utility engagement, and charging deployment.
These dashboards are dynamic tools that track the ongoing developments of charging infrastructure and advancement of public policies. This is helpful when assessing infrastructure gaps across the country and progress made in reducing them. A report published by the International Council on Clean Transportation (ICCT) in January 2019 found that 88 of 100 largest metropolitan areas in the United States are short on charging stations in the scenario where there are 3 million EVs by 2025. The study based its estimate on observed trends in the national EV market, total charging stations in operation in 2017, and charging behavior patterns.
Our dashboards demonstrate that policy matters when it comes to charging infrastructure availability. States with the least amount of supportive policies are typically the states with the lowest deployment of charging stations. You can use these dashboards to compare utility programs and policies in other states to stay on top of new developments and get a better sense of what is working.
Electric utilities are important allies for cities looking to promote transportation electrification. The Utility Filings dashboard is the only tool that aggregates the data on all investor-owned utility programs related to transportation electrification. The top 10 states with the highest number of charging stations per 1,000 people all have an active EV program run by a utility. Together, these 10 states account for 86 percent of the total utility investment in EV programs, largely thanks to California’s sizeable share (77 percent).
Summary of charging deployment and utility investments
| State | L2 Charging Stations per 1k People | Investor-Owned Utility Filing | Utility Investment |
|---|---|---|---|
|
Vermont |
0.72 |
No* |
N/A |
|
D.C. |
0.53 |
Yes |
$0 M |
|
California |
0.48 |
Yes |
$871.1 M |
|
Hawaii |
0.32 |
Yes |
$2 M |
|
Colorado |
0.31 |
No* |
N/A |
|
Oregon |
0.30 |
Yes |
$9.44 M |
|
Washington |
0.29 |
Yes |
$25.93 M |
|
Missouri |
0.26 |
Yes |
$10.5 M |
|
Kansas |
0.25 |
Yes |
$5.6 M |
|
Maryland |
0.25 |
Yes |
$52.15 |
|
Total |
|
|
$976.72 M |
*Vermont and Colorado both have utility programs under cooperatively owned utilities not captured by the utility filings dashboard
Source: Electric Utility Filings and Local EV Deployment Dashboards
One region that doesn’t face the charging gap outlined in the ICCT report is largely thanks to the work of the local utility. The Kansas and Missouri regions of the Kansas City metro area benefited from the widespread deployment of charging stations under Kansas City Power and Light (KCP&L)’s Clean Charge Network program. The initiative has rapidly increased the amount of public charging stations accessible across their service territory. In fact, the Kansas City metro area already has between 91 and 100 percent of the charging infrastructure that ICCT projected they’d need in 2025.
Despite leadership from 48 electric utilities across the country, there are still 23 states without proposals for transportation electrification programs from investor-owned utilities. Utility engagement is not a panacea for the charging gap, however, as active utilities in Kentucky and Alaska haven’t pushed those states out of the lower tier of infrastructure deployment. The ICCT report outlines the need and suggests solutions that our dashboards track closely, such as public investment and policies targeting widespread infrastructure expansion such as rebates and ZEV state mandates. You can use these tools to help visualize the connections between policy action and real world data from the national down to the local level in a way that provides structure to the general observations shared in high level reports.