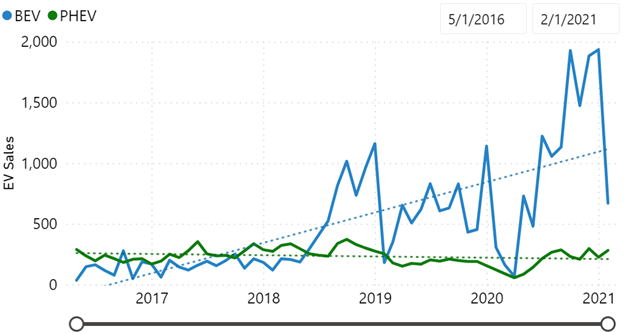
State EV policy activity has skyrocketed over the last five years with more than twice as many EV policies enacted in 2020 compared to 2015. The effects of these policies on the EV market range from stimulating adoption, like vehicle rebates, to punitive, like some annual EV registration fees. Passenger EV sales in the United States were down three percent in 2020 compared to 2019, largely as a result of pandemic challenges including reduced new vehicle demand and production challenges. Despite this dip in 2020, the doubling of annual policies related to EVs coincides with a 2.7 times increase in EV sales compared to 2015.

The EV Hub is providing a closer look at how policy influences EV adoption and EV charging deployment in the new State Policy Dashboard. This revamped tool takes all of the best parts of the EV Hub’s public policy dashboards and combines them to provide unique insights. For example, the “Policy Analysis” page allows you to view EV and charging deployment per capita for states that have and have not enacted certain policies to explore how a policy may have affected the market.
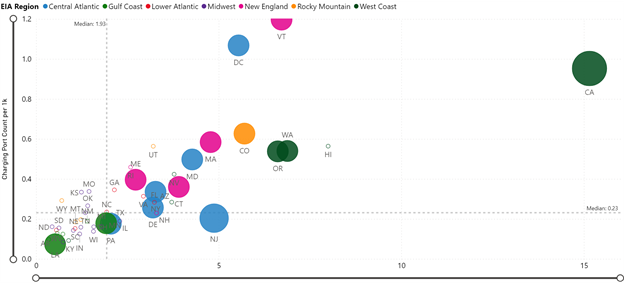
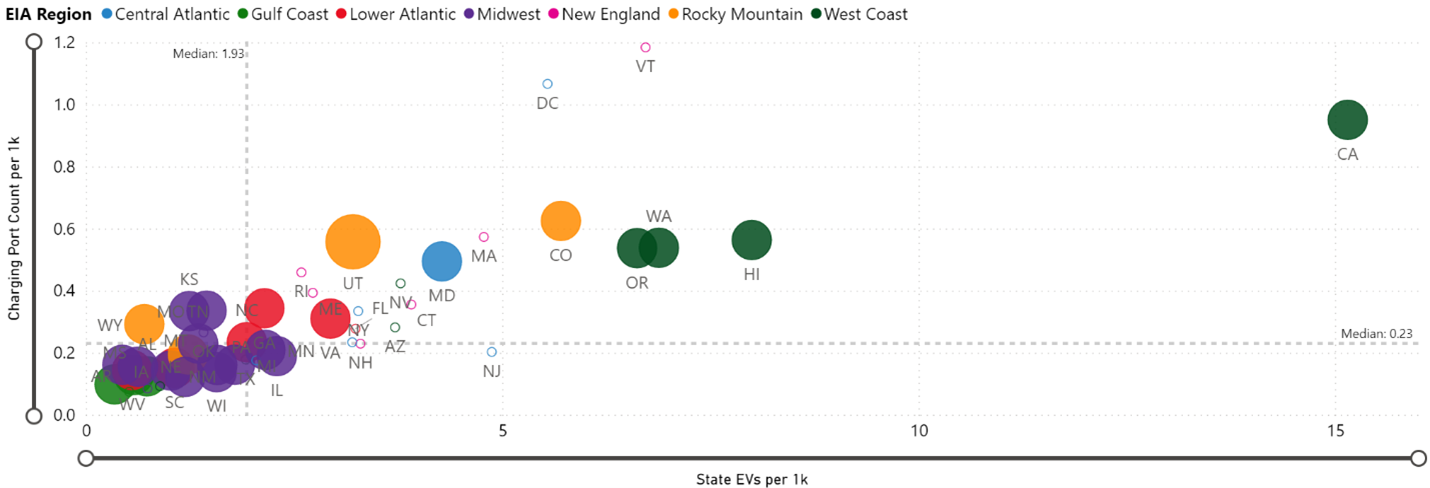
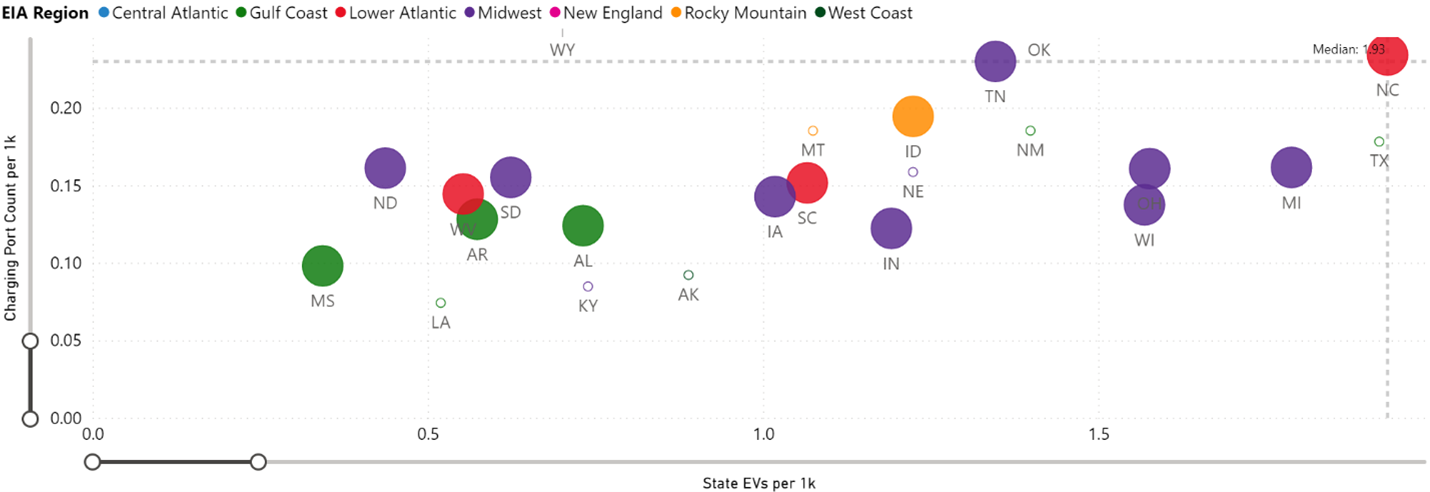
 As seen in Figure 1 below, states that have adopted EV rebates or tax credits tend to have higher per capita EV and EV charging deployment.

FIGURE 1: PER CAPITA EV AND EV CHARGING DEPLOYMENT IN STATES WITH AND WITHOUT AN BATTERY ELECTRIC VEHICLE INCENTIVES

Colored dots indicate states with active battery electric vehicle rebates, tax credits, or tax exemptions. The size of the dots corresponds to number of battery electric vehicle incentives in the state.

While state incentives can promote EV market growth, annual EV fees are an example of a policy that could inhibit EV adoption if the fee is set at levels far exceeding the state’s equivalent gas tax. Figure 2 demonstrates that most states with the lowest levels of per capita EV and charging deployment have implemented annual registration fees. In fact, 70 percent of states in the lower half of EV and charging deployment per capita have an EV fee compared to 44 percent in the upper half of states. These fees are unlikely to generate significant revenue for these states in the near term and have been seen as punitive in some cases.

Figure 2: Per capita EV and EV charging deployment in states with and without EV fees


The charts show EV and charging deployment per capita. The upper chart shows all states and the lower chart shows the states in the bottom half of states for both EV and charging deployment per capita. Colored dots indicate states with active EV fees. The size of the dots corresponds to number of active EV fee polices in the state.

Policy development is one of many factors driving disparate EV market growth throughout the country. Strong policy support in states like New Jersey has contributed to significant raise in EV sales growth over the past five years while states like Georgia have seen annual EV sales decline. Overall, California remains king in both policy activity and EV sales, claiming 46 percent of all U.S. passenger EV sales from January 2011 to February 2021. Seven out of the top 10 states for all-time EV sales have active state battery electric vehicle incentives. Five out of the ten have implemented a policy targeting 100 percent EV sales across multiple vehicle classes. Table 1 provides a closer look at these states.

Table 1: Top 10 States by All-Time EV Sales

State

EV Sales (Through February 2021)

EV Market Share (% of U.S. EV sales)

Population Share

Active State Rebate/Tax Credit

100% ZEV Sales Target**

California

797,923


46%

12%

Yes

Yes

Florida

82,271

4.7%

6.4%

No

No

New York

80,116

4.6%

5.9%

Yes

Yes

Washington

67,795

3.9%

2.3%

Yes*

Yes

Texas

67,236

3.8%

8.7%

Yes

No

New Jersey

52,037

3.0%

2.7%

Yes

Yes

Georgia

45,769

2.6%

3.2%

No

No

Massachusetts

39,553

2.3%

2.1%

Yes

Yes

Illinois

38,641

2.2%

3.9%

No

No

Colorado

38,063

2.2%

1.7%

Yes

No

Total

1,309,404

75%

49%

* Washington has a sales tax exemption for EV purchases.

** 12 states signed an MOU in April 2021 calling to electrify all passenger vehicle sales by 2035 and all medium- and heavy-duty sales by 2045. Each of the five states listed in this table have pursued either regulatory, executive, or legislative action to formalize these targets.

State policy has led to shuffling on this leaderboard over the years. In 2015, Georgia was the second-largest EV market in the country after California. This period of high EV sales in Georgia coincided with a $5,000 state EV tax credit that was active between 1997 and 2015. Since the policy was rescinded in 2015, Georgia has not cracked the top 10 states for highest annual EV sales.

New Jersey provides another example of the positive impact EV incentive programs can have on sales. At the start of 2020, the Garden State implemented a suite of supportive policies under S2252 including a $5,000 rebate for EV purchases in January 2020. The state’s annual EV sales grew by more than 40 percent in 2020 compared to 2019 while EV sales nationwide fell three percent. New Jersey’s EV sales growth was the highest of any state with annual EV sales greater than 1,000. This marked increase compares to year-over-year growth of only four percent in New Jersey between 2018 and 2019. Figure 3 shows the sales trend in New Jersey between January 2017 and February 2021.

Figure 3: New Jersey EV Sales Over Time


The increase in the EV sales trend in 2020 coincides with the enacting of several policies in January of that year under S2252, including a $5,000 rebate for EV purchases. The program was oversubscribed as of the end of 2020 and had to be temporarily paused while additional funding was secured.

In addition to showing the impact of enacted policies, the State Policy Dashboard allows users to track proposed legislation in real time as a bill makes its way through the legislative process. Table 2 below lists the 10 most recent actions by state legislatures on EV-related proposed legislation, including bill introduction, votes, enactments, and rejections.

Table 2: Notable recent updates to supportive EV-related proposed legislation

State

Latest Update

Policy

Description

Bill Number

Bill Status

New York

4/26/2021

100% EV Sales Target

Sets goals to electrify all passenger vehicle sales by 2035 and all medium- and heavy-duty sales by 2045

S2758

Enacted

Washington

4/24/21

Clean Fuel Standards

Establishes a clean fuel standard in Washington. Goal to reduce carbon intensity from the on-road transportation sector by 45% by 2030.

HB1091

Enacted

Maryland

4/12/2021

Charging Incentive

Provides rebates for charging stations across multiple use cases

HB44

Under Consideration

Maryland

4/12/2021

Transportation Electrification Plan

Sets targets for medium- and heavy-duty and state fleet electrification

SB414

Under Consideration

North Carolina

4/7/2021

State BEV/PHEV Incentive

Applies a $3,000 income tax credit to EV purchases

HB342

Under Consideration

Virginia

3/31/2021

State BEV/PHEV Incentive

Established a statewide EV rebate of $2,500

HB1979

Enacted

Virginia

3/30/2021

MD/HD Incentive

Establishes a rebate program for medium- and heavy-duty vehicles

HB2118

Enacted

Illinois

3/27/21

Building Codes/ Utility Enabling Legislation

Sets EVSE building codes, establishing right-to-charge policies, and requiring utilities to file TEPs.

HB3125

Under Consideration

Virginia

3/18/21

ZEV Program

Proposed adoption of ZEV Program

HB1965

Enacted

New York

3/8/2021

Clean Fuel Standards

Establishes a clean fuel standard in New York. Goal to reduce carbon intensity from the on-road transportation sector by 20% by 2030.

A862A

Under Consideration

This table lists notable recent EV-related proposed legislation, including bill introduction, adoption, rejection, or other activity in state legislatures.

Virginia is an example of an EV market on the rise with three recent supportive policy actions tracked on the dashboard. Virginia is the only state that has enacted an EV rebate program thus far in 2021. If enacted, Virginia would be the only state in the Southeast to actively offer such a policy. Virginia also became the 13th state to join the ZEV program in March 2021. All of this will likely have a positive impact on EV sales and other key metrics in the state, which currently ranks 15th out of all states in all-time EV sales.

The State Policy Dashboard also highlights which types of policies are being most actively pursued. For example, in Figure 4 below, the graphic on the left shows that there are many annual fee policies being proposed. The graphic on the right shows where these policies are being proposed.

Figure 4 Location of Most Popular Proposed Legislation in the Last 12 Months


This figure shows that many annual EV fees have been proposed in the last 12 months throughout the country.  

Nationwide, transportation electrification targets are the most common policy that has been enacted in the last 12 months with 16 states taking this approach. Building codes are the most common legislation that has been proposed with 12 new policies seeing some form of action in the last year. The EV Hub relies on its users to make sure the most recent developments are being surfaced. If you are aware of any updates that we have missed, do not hesitate to reach out to us here. This is the first of two data stories focused on the new State Policy Dashboard. Stay tuned for the second one focused on the public requests and funding aspect of this tool.

Related Content on EV Hub

[is logout]You must be logged in to view this content.[/is]

Learn More

About the author: Conner Smith