Image Source: Atlas EV Hub
This week, EV Hub and the Electrification Coalition are launching a refreshed and expanded version of the Electric Freight Dashboard. This revamp integrates the National Zero Emission Freight (ZEF) Corridor Strategy with real-world charging data including locations, detailed freight hub information, and state policy context. This update brings key layers of the electric freight landscape into a single, map-based experience. The Electric Freight Dashboard shows where activity is already clustering, where enabling conditions are forming, and where early gaps represent opportunities for more targeted planning and coordination among policymakers and industry. Together, these updates iterate on the ZEF Corridor Strategy and creates an interactive, continuously updated resource. Users can now see where federal strategy, state policy, and infrastructure buildout overlap – and where they do not – and the actual pace and geography of deployment.
Here’s What’s New
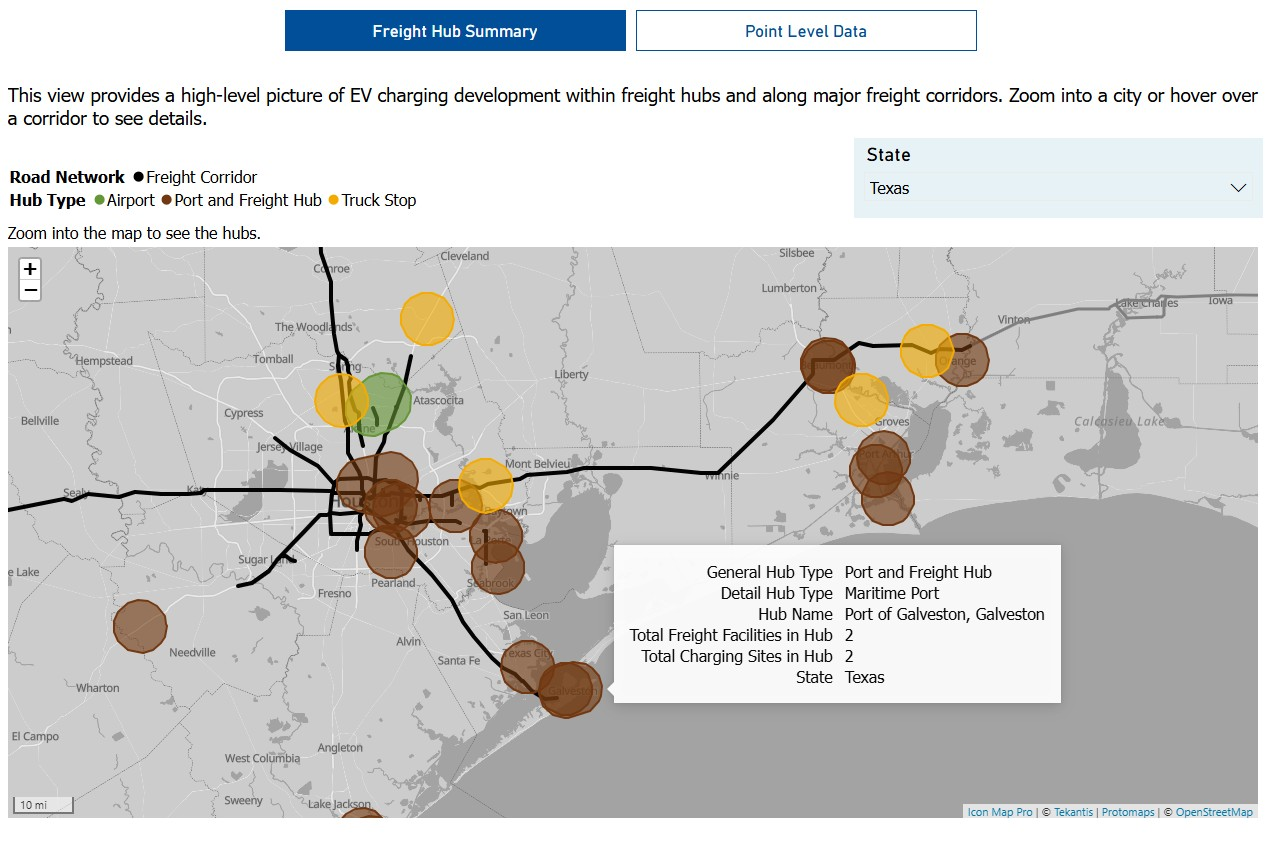
Freight Hub Summary View
The dashboard displays the full set of Phase 4 freight hubs from the ZEF Corridor Strategy. Each hub is displayed with a 5‑mile service radius representing the area where EV charging infrastructure could be most likely to support operations at that site.
Enhanced pop-ups known as Tooltips (see Figure 1) help users quickly interpret conditions at each hub, including:
- Hub type (port, airport, truck stop, freight rail facility, etc.)
- Number of freight facilities within the hub
- Number of charging sites within the hub radius, combining data from the Alternative Fuels Data Center (AFDC) with Atlas’ manually tracked medium/heavy duty charging sites.
Figure 1. Freight Hub Summary Overview
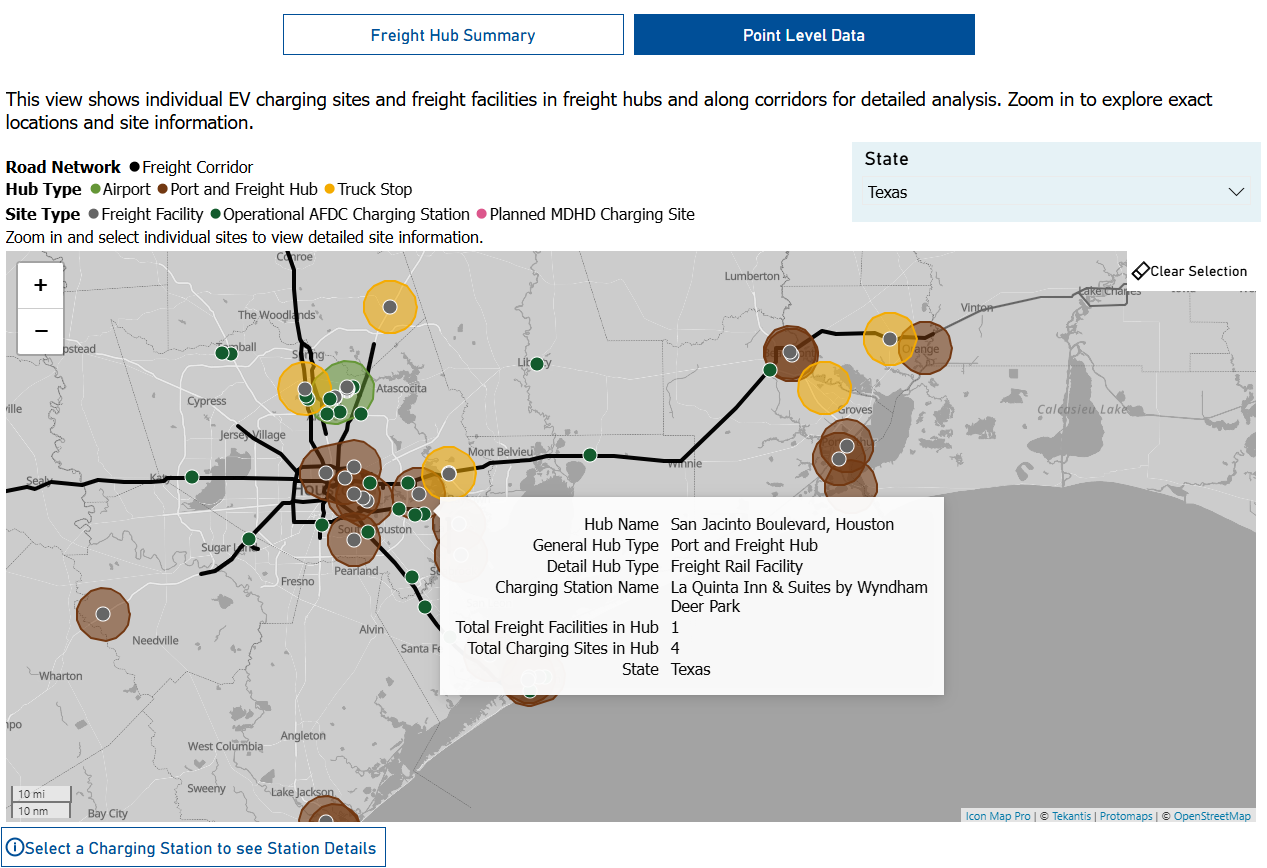
Point Level Data View
For deeper analysis, users can also utilize the Point Level Data view (see Figure 2). This view displays individual freight facilities and EV charging sites at a granular level. Selecting a site opens the option to review AFDC’s full site details: charger type, power level, network, access rules, and payment methods. [1]
Figure 2. Point Level Data View Insights
State Policies Tab: A Consolidated View of Freight Relevant Policies‑Relevant Policies
The updated State Policies tab now offers an updated tooltip summarizing each state’s freight relevant policy levers, including: ACT adoption status; Heavy-Duty Omnibus adoption; clean fuel standards; GVWR weight exemptions; fleet transition programs; Port clean truck programs; and MHDV vehicle and charging incentives.
With these new updates, here are a couple of new insights that emerged from the data.
Corridor level differences in freight electrification highlight opportunities‑level differences
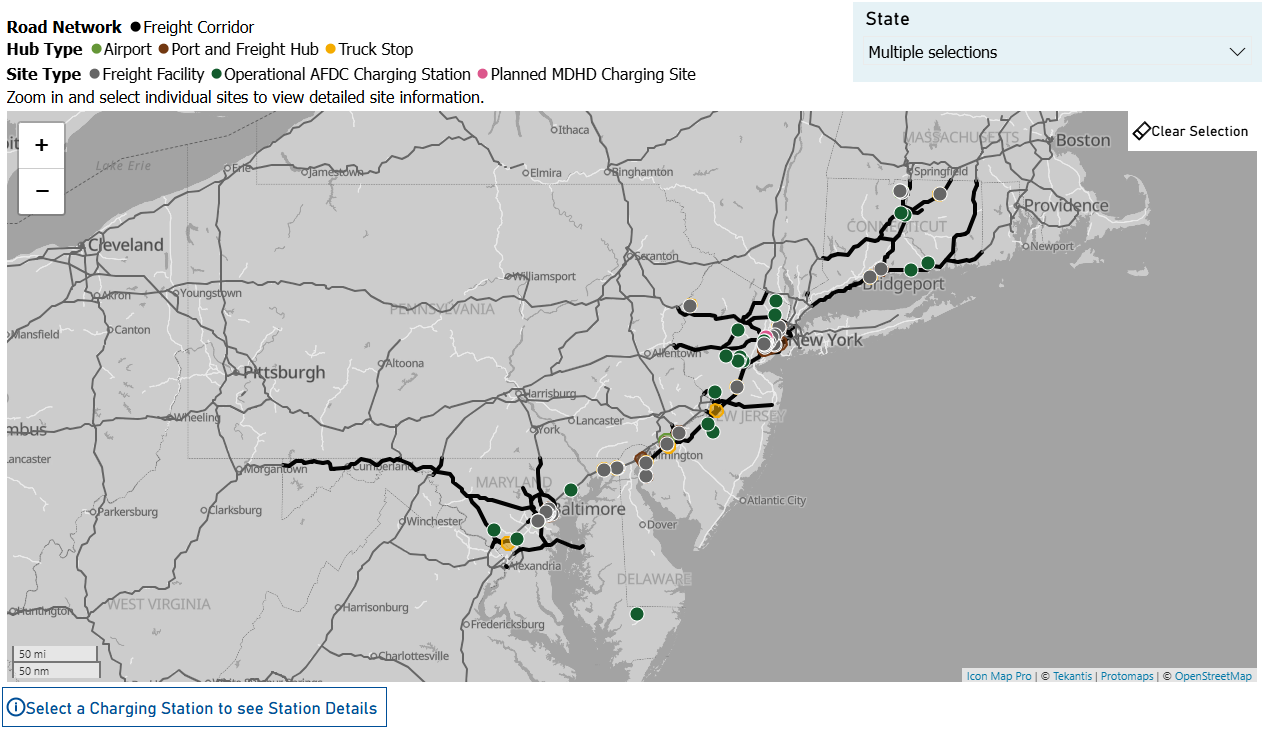
Early deployment clusters are forming along several of the country’s most critical freight routes. For example, the I‑5 corridor currently has 135 MDHD‑capable charging sites within 10 miles, followed by strong early activity along I‑10 (119 sites). Similarly, the corridor‑level charging that is visible today in the Northeast (see Figure 3) can complement other initiatives by helping stakeholders understand where early commercial‑scale charging is already emerging and where fleet, utility, or federally supported projects may further accelerate progress in tandem. For example, the Clean Corridor Coalition, a partnership of four Northeast states that received nearly $249 million to deploy commercial zero‑emission MDHD charging infrastructure along I‑95, will develop approximately 20 freight‑focused charging sites and more than 450 charging ports between 2025 – 2030, creating one of the country’s first large‑scale, multi‑state zero emission freight corridors (see Figure 3).
Figure 3. Northeast United States Shows Initial Charging Site Deployment
Freight hubs offer insight into where deployment has begun.
States such as Texas (48 hubs with nearby charging sites), California (28), Illinois (28), and Pennsylvania (24) show comparatively higher levels of hub adjacent charging activity. These states typically align with large freight markets or states with supportive policy and utility engagement. These patterns help illustrate where deployment is beginning to coalesce and where freight hubs may benefit most from future infrastructure planning. These states typically align with large freight markets or states with supportive policy and utility engagement.
Across hubs, corridors, and states, the data reveals a freight system in transition: early activity in several regions, new models of multistate coordination, and potential opportunities for investment and policy action where deployment remains limited. The Electric Freight Dashboard enables users to visualize these dynamics and identify the corridors, hubs, and policy structures most likely to benefit from near term investment and collaboration.
Atlas will continue updating the dashboard as new charging locations are announced, state policies evolve, and EV fleet deployment progresses. If you’d like to support the continued evolution of the freight dashboard or have suggestions on data or insights we should include in a future update to the tool, please reach out to us at info@atlasevhub.com and freight@electrificationcoalition.org.
[1] AFDC‑listed charging sites appear on the dashboard as medium- and heavy‑duty (MDHD) capable when they provide adequate space and trailer‑throughput for freight operations, even if they were not explicitly built as MDHD‑dedicated stations. This distinction is important as it reflects the still nascent freight‑charging landscape, but one that already offers usable capacity for early adopters.