Figure 1: Running Tallies from Sample of Utility Progress Reports
Since 2012, investor-owned utilities (IOUs) in the United States have been approved to invest in 112 electric vehicle (EV) programs across 31 states. Atlas has been able to find and review utility reports on the implementation of 50 of these programs across 17 states1. Figure 1 above shows running tallies of some key metrics Atlas is tracking in these reports. The sample of reports further reveals:
- At least six out of 16 programs that reported charger deployments in underserved communities are exceeding their commitments, in many cases by more than 100 percent. California programs make up more than 95 percent of the reported chargers in underserved communities.
- Utilities reported average hardware and installations costs of more than $8,000 per Level 2 port, with about $15,000 per Level 2 port for California programs. These costs are significantly higher than ICCT’s estimated costs of $6,000 per Level 2 port, possibly due to differences in the costs included in the utility reports and the ICCT report, or the timing of the charger installations (the California programs were approved earlier than many of the other programs included in this sample of reports).
- Programs in the sample have reached 37 percent of their targeted charger deployments and are, on average, 60 percent through their program terms. Figure 2 illustrates this information, plotting percent of target installations against the percent of program term complete.
Figure 2: Installed Chargers (Percent of Approved Target) by Program Term Complete (Percent of Years)
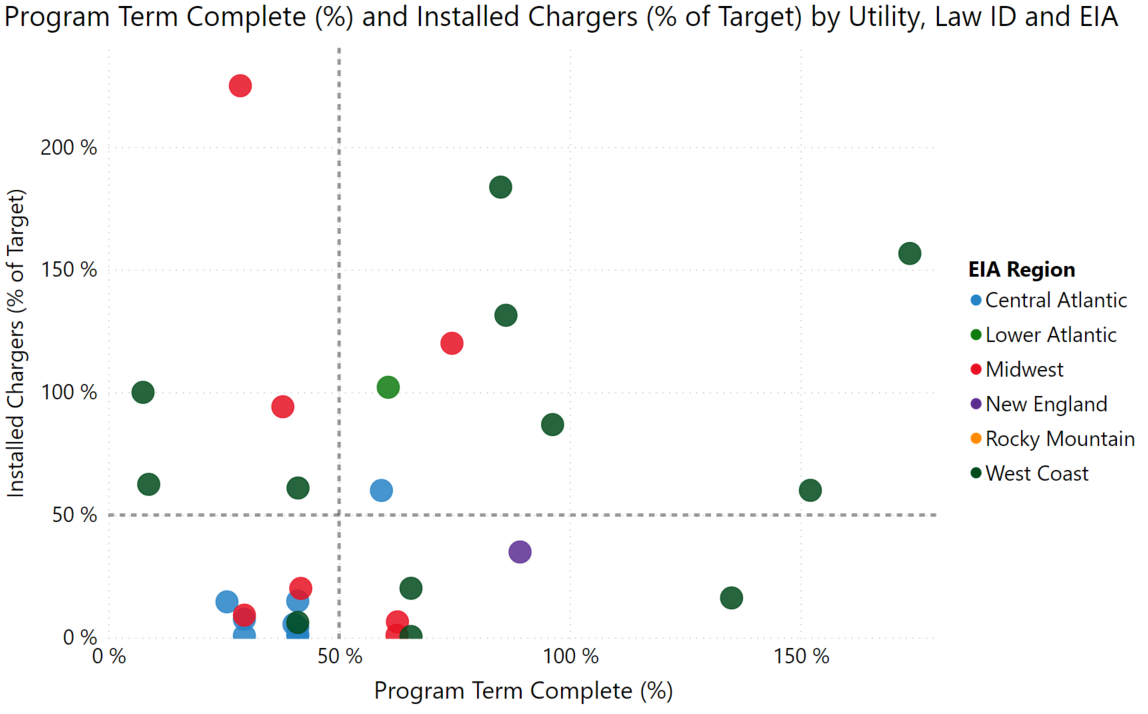
This figure shows investor-owned utility (IOU) program progress toward reaching EV charger installation targets (y-axis) compared to how much of the program term is complete (x-axis). Each dot represents an approved IOU program, and the color of the dot corresponds to the U.S. Energy Information Administration region of the IOU’s service territory. Programs in the sample have reached 37 percent of their targeted charger deployments and are, on average, 60 percent through their program terms. (Note: Program terms greater than 100 percent indicate that the program has continued beyond the term established in the approved program.)
This sampling of utility programs in the United States covers the deployment of more than 279 DC fast chargers and at least 18,564 Level 2 charging ports, representing 22 percent and 54 percent, respectively, of the planned totals in the corresponding approved programs. For some reference, Electrify America, the nation’s largest non-Tesla fast charging network provider has installed around 2,800 DC fast chargers since 2017 and ChargePoint, the nation’s largest Level 2 network provider, has installed more than 43,000 Level 2 ports over the last 14 years. In terms of spending, the utilities in this sample have spent at least $323 million on transportation electrification initiatives, representing about 28 percent of planned funding in the corresponding approved programs. And again for context, Electrify America will invest $2 billion over a 10-year spending requirement from the Volkswagen Settlement and the recent bipartisan infrastructure bill that was passed by the Senate (H.R. 3684) includes $7.7 billion for EV infrastructure.
Within the sample of programs reviewed, utilities have made significantly more progress toward reaching charger deployment targets for Level 2 chargers than for DC fast chargers. Specifically, utilities have supported the deployment of 54 percent of approved Level 2 ports compared to only 22 percent for DC fast chargers. On an individual program basis, for both DC fast chargers and Level 2 ports, these percentages vary widely, ranging from less than one percent to more than double the approved target. Importantly, most of these programs are not yet complete and will therefore ultimately support more chargers. Table 1 summarizes the number of installed chargers by charger type in the sample of utility reports reviewed along with the share this equipment represents of the planned totals in the corresponding approved programs. The table at the end of this story provides a program-level summary of chargers installed by charger type.
Table 1: Installed Utility-Supported EV Chargers by Type
|
Charger Type |
Average Project Completion |
Installed |
Approved |
Percent of Approved |
|
DCFC |
56% |
279 |
1,278 |
22% |
|
L2 Charging Ports |
64% |
18,564 |
34,665 |
54% |
|
MDHD Chargers |
47% |
196 |
15,751 |
1% |
|
Off-Road Vehicle Chargers |
54% |
44 |
93 |
47% |
|
Other/Multiple |
41% |
102 |
Not specified |
N/A |
|
Total |
|
19,185 |
51,787 |
37% |
This table summarizes total installed chargers by charger type in the sample of utility reports reviewed. More than 19,000 chargers have been installed, representing 37 percent of the planned totals in the corresponding approved programs. The “Approved” column only includes approved chargers associated with programs for which Atlas was able to find reporting on installed chargers. For example, for an approved program that targets 100 DCFC and 200 Level 2 ports, if Atlas was only able to find reporting on the number of Level 2 ports installed, the 200 Level 2 ports would be included in the “Approved” column but the 100 DCFC would not be included in the Approved column. This allows an apples-to-apples comparison of the “Installed” column to the “Approved” column. Project completion is calculated as the time period between a program approval date and the date of the most recent report for that program divided by the approved program term.
Atlas identified 16 utility reports that included information on the number of chargers deployed in underserved communities. Within these reports, 31 percent of installed chargers have been in underserved communities. At least six of these 16 programs are exceeding their commitments, in many cases by more than 100 percent. Table 2 summarizes the number of chargers installed in underserved communities and compares these numbers to the targets established in the approved programs. Notably, California programs make up more than 95 percent of the reported chargers in underserved communities.
Table 2: Utility-Supported Chargers in Underserved Communities
|
Utility |
State |
Filing Identifier |
Charger Type |
Chargers in Underserved Communities |
Number Chargers Installed |
Underserved Communities (%) |
Commitment in Approved Program |
|
Southern California Edison |
CA |
A1701021 |
MDHD |
30 |
30 |
100% |
40% |
|
Southern California Edison |
CA |
A1701021 |
Off-Road |
16 |
16 |
100% |
none/unknown |
|
San Diego Gas & Electric |
CA |
A1701020 |
MDHD |
64 |
79 |
81% |
67% |
|
Pacific Gas & Electric Company |
CA |
A1701022 |
MDHD |
10 |
15 |
67% |
25% |
|
San Diego Gas & Electric |
CA |
A1701020 |
Level 2, DCFC |
44 |
88 |
50% |
none/unknown |
|
Southern California Edison |
CA |
A1410014 |
Level 2 |
1,272 |
2,755 |
46% |
67% |
|
San Diego Gas & Electric |
CA |
A1701020 |
Off-Road |
12 |
28 |
43% |
none/unknown |
|
Southern California Edison |
CA |
A1701021 |
DCFC |
6 |
14 |
43% |
100% |
|
Puget Sound Energy |
WA |
UE-180877 |
DCFC |
2 |
5 |
40% |
none/unknown |
|
Pacific Gas & Electric Company |
CA |
A1502009 |
Level 2 |
1,747 |
4,504 |
39% |
40%-50% |
|
San Diego Gas & Electric |
CA |
A1910012 |
Level 2 |
853 |
3,040 |
28% |
10% |
|
Pacific Gas & Electric Company |
CA |
A1807020 |
Level 2 |
53 |
230 |
23% |
40% |
|
Duke Energy |
FL |
20170183-EI |
Level 2 |
79 |
504 |
16% |
10% |
|
Puget Sound Energy |
WA |
UE-180877 |
Level 2 |
6 |
46 |
13% |
none/unknown |
|
Duke Energy |
FL |
20170183-EI |
DCFC |
4 |
37 |
11% |
10% |
|
Southern California Edison |
CA |
A1701021 |
Level 2 |
187 |
2,670 |
7% |
50% |
|
Total |
|
|
|
4,385 |
14,061 |
31% |
|
This table summarizes the number of chargers installed in underserved communities and compares these numbers to the targets established in the approved programs.
Several utility reports Atlas reviewed included installation cost information. Among these reports, for Level 2 hardware and installation, utilities spent on average about $8,000 per port, with costs ranging from $1,423 per port for residential chargers in Baltimore Gas & Electric’s service territory to $17,892 per port for chargers at workplaces and multi-unit dwellings (MUDs) in Pacific Gas & Electric’s service territory. Installation costs for residential chargers were the least expensive with all three of the lowest reported per port costs coming from residential programs.
For a point of comparison, the International Council for Clean Transportation (ICCT) estimated Level 2 hardware and installation costs for public and workplace chargers to be around $6,000 per port, about 25 percent lower than the average from the utility reports reviewed2. Level 2 costs were highest in California, with an average reported cost of $15,453 per port for non-residential chargers. Among non-California programs, the average reported cost for non-residential chargers was $7,125 per port. It is worth noting that the California programs that reported per port costs were all approved in 2016, whereas several of the programs from other states were approved more recently, ranging from 2016 to 2019. EV charging installations in the early days of the market were likely more expensive than they would be now. In addition, while Atlas aimed to only include per port costs that included utility-side make-ready infrastructure, customer-side make-ready infrastructure, and EVSE hardware, it is possible that some of the California programs included some costs that other programs or the ICCT did not. For example, the PG&E program that reported $17,892 per port included site design and it is not clear whether other programs or the ICCT included this element. In addition, across utility reports, it was not always clear whether costs such as general and administrative overhead were included. The Rocky Mountain Institute notes that these costs can contribute 20 percent or more to total costs, so if some reports included these costs and others did not, that could help explain some of the differences across reports.
For DC fast chargers, reported costs were closer to the ICCT’s estimated hardware and installation cost of about $115,000 per DC fast charger, ranging from just under $46,000 per charger in Duke Energy’s Florida service territory to $167,000 per charger in Hawaiian Electric Company’s service territory and averaging $115,000 per charger. Even excluding the $46,000, which was significantly lower than the reported costs in other programs, the average cost per DC fast charger was $129,600 per charger, not too far off from ICCT’s estimated costs. Table 3 summarizes reported installation cost data for DC fast chargers and Level 2 chargers from the sample of programs reviewed.
Table 3: Reported DC Fast Charger and Level 2 Charger Installation Costs
|
DC Fast Chargers |
Level 2 Ports |
|
|
Average Reported Cost per Port |
$115,645 |
$8,084 |
|
Lowest Reported Cost per Port |
$45,872 |
$1,423 |
|
State with Lowest reported cost |
Florida |
Maryland (home chargers) |
|
Highest Reported Cost per Port |
$167,415 |
$17,892 |
|
State with Highest reported cost |
Hawaii |
California (Workplace, MUD) |
|
Installed Ports in Sample |
107 |
8,480 |
This table summarizes reported per port cost data found in the sample of utility progress reports reviewed. The costs include installation and equipment costs.
Stay tuned in the coming months for a new EV Hub dashboard that will incorporate all of this data and more that Atlas has collected from its utility report tracking efforts. If you know of a utility report that is not included in Table 4 at the bottom of this page that we should add to our tracking efforts, please let us know.
1 Atlas finds and reviews reports associated with approved investor-owned utility transportation electrification programs. Not all approved utility programs have issued public reports and not all reports include the same information (e.g., not all reports include cost data or charger deployment data) so the information in this data story does not represent a comprehensive summary of implemented utility transportation electrification programs.
2 The ICCT’s installation costs include labor, materials, permits, taxes, and utility upgrades.
Related Content on EV Hub
Learn More

Table 4: Program-Level Summary of Installed Utility Supported Chargers by Charger Type
|
Utility |
State |
Filing Identifier |
Program Term Complete (as of Most Recent Report Reviewed) |
Reported Costs |
DCFC Chargers Installed |
Level 2 Chargers Installed |
MDHD/Off-Road/Other |
Total |
|
Pacific Gas & Electric Company |
California |
A1502009 |
152% |
$110,800,957 |
4,504 |
4,504 |
||
|
San Diego Gas & Electric |
California |
A1404014 |
96% |
$69,779,484 |
3,040 |
3,040 |
||
|
Southern California Edison |
California |
A1410014 |
85% |
$43,913,465 |
2,755 |
2,755 |
||
|
San Diego Gas & Electric |
California |
A1701020 |
41% |
$11,578,492 |
4 |
6 |
195 |
205 |
|
Southern California Edison |
California |
A1701021 |
66% |
$9,857,031 |
14 |
2,670 |
46 |
2,730 |
|
Baltimore Gas and Electric Company |
Maryland |
9478 |
41% |
$8,409,273 |
19 |
58 |
14 |
91 |
|
Puget Sound Energy |
Washington |
UE-180877 |
41% |
$8,322,638 |
5 |
46 |
51 |
|
|
DTE Energy Company |
Michigan |
U-20162 |
42% |
$7,959,460 |
88 |
637 |
44 |
769 |
|
National Grid |
Massachusetts |
17-13 |
89% |
$6,552,591 |
1 |
446 |
447 |
|
|
Pacific Gas & Electric Company |
California |
A1701022 |
66% |
$6,351,464 |
8 |
24 |
32 |
|
|
Duke Energy |
Florida |
20170183-EI |
61% |
$5,684,324 |
37 |
504 |
541 |
|
|
AEP Ohio |
Ohio |
16-1852-EL-SSO |
38% |
$3,995,000 |
32 |
321 |
353 |
|
|
Avista Utilities |
Washington |
160082 |
174% |
$3,851,125 |
7 |
432 |
439 |
|
|
Hawaiian Electric Company |
Hawaii |
2013-0000 |
135% |
$3,815,521 |
17 |
17 |
||
|
Consumers Energy |
Michigan |
U-20134 |
29% |
$2,687,600 |
298 |
298 |
||
|
Potomac Electric Power Company |
Maryland |
9478 |
41% |
$2,114,225 |
1 |
193 |
194 |
|
|
Rocky Mountain Power |
Utah |
16-035-36 |
24% |
$2,000,000 |
||||
|
Consolidated Edison Company |
New York |
16-E-0060-263 |
124% |
$1,834,618 |
||||
|
Xcel Energy |
Minnesota |
M-15-111 |
$1,731,995 |
|||||
|
Central Hudson Gas & Electric Corporation |
New York |
17-E-0459 |
88% |
$1,718,262 |
||||
|
Potomac Edison |
Maryland |
9478 |
41% |
$1,430,220 |
2 |
12 |
14 |
|
|
Duquesne Light Company |
Pennsylvania |
R-2018-3000124 |
26% |
$1,142,442 |
98 |
2 |
100 |
|
|
Indianapolis Power & Light Company |
Indiana |
44478 |
29% |
$1,130,000 |
450 |
450 |
||
|
Puget Sound Energy |
Washington |
131585 |
196% |
$996,500 |
||||
|
Delmarva Power |
Maryland |
9478 |
41% |
$975,317 |
4 |
4 |
||
|
Xcel Energy |
Minnesota |
M-18-643 |
63% |
$968,534 |
10 |
10 |
||
|
Xcel Energy |
Minnesota |
M-17-817 |
103% |
$648,836 |
320 |
320 |
||
|
National Grid |
Massachusetts |
18-150 |
32% |
$637,003 |
||||
|
Pacific Gas & Electric Company |
California |
A1807020 |
86% |
$570,000 |
230 |
230 |
||
|
Ameren Missouri |
Missouri |
ET-2018-0132 |
63% |
$522,443 |
10 |
45 |
55 |
|
|
Portland General Electric |
Oregon |
UM-1811 |
9% |
$310,500 |
24 |
12 |
4 |
40 |
|
Xcel Energy |
Minnesota |
M-19-186 |
41% |
$218,546 |
142 |
142 |
||
|
Liberty Utilities |
California |
A1706033 |
51% |
$183,481 |
||||
|
Consolidated Edison Company |
New York |
19-E-0065 |
28% |
$173,000 |
||||
|
Bear Valley Electric Service |
California |
A1706034 |
51% |
$75,000 |
||||
|
Pacific Power |
California |
A1706031 |
255% |
$73,790 |
||||
|
Potomac Electric Power Company |
District of Columbia |
FC1130 |
40% |
$67,701 |
4 |
4 |
||
|
Hawaiian Electric Company |
Hawaii |
36220 |
26% |
$19,518 |
||||
|
LG&E and KU |
Kentucky |
2015-00355 |
74% |
24 |
24 |
|||
|
Consolidated Edison Company |
New York |
14-M-0101 |
59% |
3 |
3 |
|||
|
National Grid |
New York |
17-E-0238 |
110% |
1,313 |
1,313 |
|||
|
Southern California Edison |
California |
A1807022 |
81% |
|||||
|
Consolidated Edison Company |
New York |
18-E-0138 |
29% |
3 |
3 |
|||
|
Orange and Rockland Utilities |
New York |
18-E-0138 |
29% |
3 |
3 |
|||
|
Minnesota Power |
Minnesota |
19-337 |
34% |
|||||
|
Hawaiian Electric Company |
Hawaii |
2018-0422 |
8% |
4 |
4 |
|||
|
Consolidated Edison Company |
New York |
18-E-0138 |
9% |
|||||
|
Orange and Rockland Utilities |
New York |
18-E-0138 |
9% |
|||||
|
Consolidated Edison Company |
New York |
14-M-0101 |
43% |
|||||
|
Total |
279 |
18,564 |
342 |
19,185 |
Atlas has been working over the past several months to find and review reports associated with approved utility transportation electrification programs. Not all approved utility programs have issued public reports and not all reports include the same information (e.g., not all reports include cost data or charger deployment data) so the information in this data story does not represent a comprehensive summary of implemented utility transportation electrification programs. Atlas searched for reports for all approved utility programs for which the commission approval indicated reporting was required. If you are aware of a publicly-available report that we have not included, please let us know. The column “Program Completion as of Most Recent Report Reviewed by Atlas” is the time period between the program approval date and the date of the most recent report divided by the approved program term.