I need to flag an enormous conflict of interest at the outset. I am writing today about research I did with colleagues at Atlas. It is decent analysis, but that’s what they all say, right?
The analysis is a model-to-model total cost of ownership comparison between gasoline vehicles and electric vehicles. In other words, when someone is looking to buy a vehicle in 2022, how do EVs fare against some of the most popular gasoline vehicles in the country over an 8-year timeframe with all costs included?
Very favorably indeed.
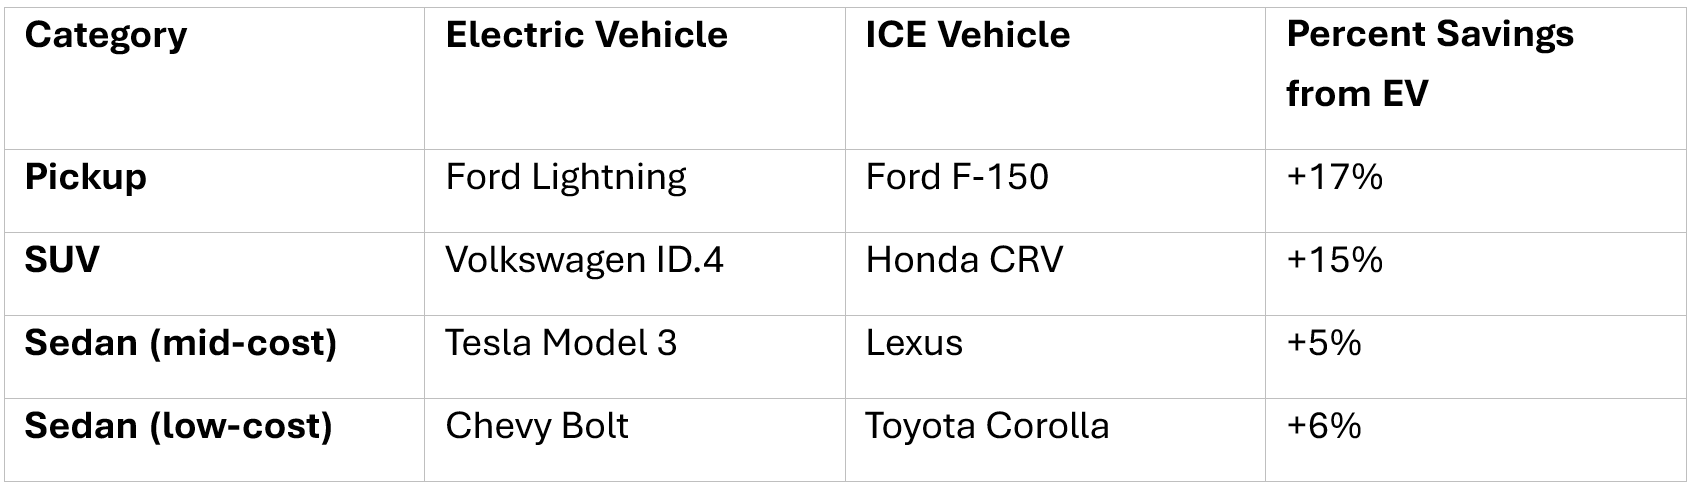
We looked at four vehicle categories – low-cost sedan (below $30,000), mid-cost sedan (above $40,000), SUV and pickup. For each of the categories, we identified the highest selling vehicle (except the Ford F-150 which was the second highest selling pickup, but the most apt comparison vehicle to the F-150 Lightning to be released in 2022).
In all four categories, the EV was cheaper than its gasoline counterpart for the total cost of ownership (TCO). Our analysis found the total cost of owning the forthcoming electric version of the Ford F-150 (the F150 Lightning) is 17 percent lower than the gas-powered version, the cost of the electric Volkswagen ID.4, an SUV, is 15 percent less than the Honda CRV, a Tesla Model 3 costs almost 5 percent less than a similar Lexus, and the Chevy Bolt costs 6 percent less than a Toyota Corolla.
This analysis goes a step further than previous total cost of ownership analysis, which mostly examines costs across vehicle classes, but not individual vehicles. It is also updated for 2022, a recognition of how quickly the EV market is changing.
We calculated the TCO using the Atlas Fleet Procurement Analysis Tool. But a model is only as good as its assumptions, so let’s dig into them. The analysis included the latest data on vehicle purchase price, maintenance and fuel costs, taxes, fees, and depreciation to create a total cost of ownership comparison between electric and gas-powered vehicles.
We considered that the vehicle would drive 15,000 miles per year and assumed that the vehicle would be in use for 8 years (aligned with vehicle battery warranties). We assumed a nationwide average for gas prices of $3 per gallon. For charging that happens at home, we used a nationwide average of residential electricity rates of 14 cents per kWh and for charging that happens at public chargers we used Electrify America public charging costs of 34 cents per kWh. We assumed 88 percent home charging using the midpoint of a range produced in a report from the National Renewable Energy Laboratory. The manufacturer’s suggested retail price (MSRP) of vehicles was drawn from FuelEconomy.gov and we did not factor in charging installation costs. The rest of the assumptions and inputs for the model can be found here.
The assumptions in this analysis do not account for two significant costs however – climate and health costs. Transportation remains the largest source of climate pollution in the U.S., and vehicle-related pollution continues to cause higher rates of asthma, cancer, and premature death in communities near major roads, transit hubs, and travel corridors. Note that the tool is able to calculate the greenhouse gas savings between vehicles.